This post by Trudy Ledsham, is part of Spacing’s partnership with the Toronto Cycling Think & Do Tank at the University of Toronto. Trudy is a researcher for both the Toronto Cycling Think & Do Tank and the Scarborough Cycles Project at the Toronto Centre for Active Transportation, a project of Clean Air Partnership. Scarborough Cycles is funded by the Metcalf Foundation’s Cycle City program, which aims to build a constituency and culture in support of cycling for transportation.
A common narrative in discussions of urban suburban divides is that suburbanites both love and own automobiles while city dwellers live car free. This is a deeply rooted assumption that quietly justifies the lack of investment in alternatives to cars in suburban areas. A deeper examination of Scarborough suggests that the idea of monolithic suburban car ownership is a myth. Many households within Scarborough do not own a car and a smaller proportion of Scarborough residents has a driver’s license compared to residents in the core.
Mapping is a wonderful tool that allows people to see spatial patterns. But those patterns are completely dependent on the geographic frame, variable or unit of measure that the cartographer chooses. When automobile ownership is examined for Toronto as a whole, it can appear that households in areas like Scarborough all have cars. It is true that household car ownership is higher in Scarborough with an average of 1.3 vehicles per household than in the downtown core (former city of Toronto) where the household average is 0.7 vehicles per household. But this measure does not take into account the number of people in a household. In Scarborough, there is an average of 2.9 persons per household while in the core there are only 1.9 persons per household. If examined on a per person basis, Scarborough has 0.44 cars per person while the city core has 0.36 cars per person–still lower but not as extreme (Table 1). And yes, households in Scarborough have more children than households in the core with 18% of the population aged 0 to 15 compared to only 8% in the core. While not including children in per capita measures might more accurately reflect car ownership, it doesn’t necessarily relate to travel needs. Children also need to travel and walking, cycling and transit are more challenging for parents and caregivers in areas with low transit service levels, little cycling infrastructure and poor walkability.[1]
Scarborough surprises in other ways. The median trip length for drivers is 5.2 km in Scarborough versus 4.9 km in the city core—a negligible difference. In the key 6AM to 9AM travel period, drivers from the core actually travel further than drivers in Scarborough (median trip distance 7.9 km versus 6.5km). In the literature on factors influencing car ownership, a higher % of the population licensed to drive is generally related to higher levels of car ownership[2]. Based on this we would expect the core to have a smaller proportion of residents with drivers’ licenses than Scarborough. However, both men and women in Scarborough are actually less likely to have a driver’s license than residents in the core, with only 54% of women in Scarborough having a license. Given that women account for a higher proportion of the population in Scarborough than in the core (52% vs 50%–see Table 2) the disparity is pronounced, resulting in a much lower number of drivers in Scarborough than would be expected, based on car ownership.
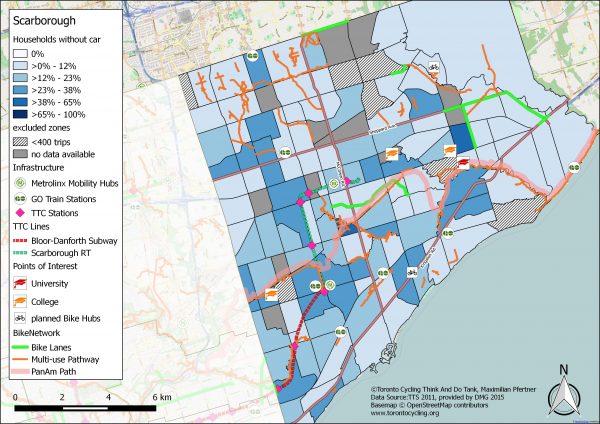
Given the lack of alternative travel options within Scarborough, .44 cars per person is very low. Scarborough has a higher proportion of women and seniors as well as children than the city core — there is also a slightly higher proportion of lone-parent families and a higher proportion of 1st generation immigrants in Scarborough than in the city as a whole. Many travellers are likely avoiding discretionary trips and adding extra miles to their commutes to drop off a series of family members, while others suffer long trips using sporadic or remote public transit. Disparity in transportation access is intimately linked to inequality in social, environmental and health conditions and outcomes[3], making transportation access in Scarborough an even more urgent priority, as Scarborough has both poor transportation access and high levels of vulnerable populations.If we look at a map of car ownership in Scarborough (Figure 1), we find that many households do not have even a single car. There are pockets of Scarborough where more than 38% of households do not own cars. These pockets are consistently distant from higher order transit services. We also see that in Scarborough, the limited cycling infrastructure available (especially bike lanes) is all located in areas of high car ownership. This leaves those without cars completely dependent on walking and bus service.
Toronto’s suburbs are not monoliths of single family homes with multiple cars. Given the long time horizon on transit infrastructure improvement and current limited active transportation options, Scarborough residents urgently need prompt investment and rapid implementation of active transportation infrastructure and programming.
[1] Prillwitz, J., Harms, S., & Lanzendorf, M. (2006). Impact of life-course events on car ownership. Transportation Research Record: Journal of the Transportation Research Board, (1985), 71-77.
[2] Potoglou, D., & Kanaroglou, P. S. (2008). Modelling car ownership in urban areas: a case study of Hamilton, Canada. Journal of Transport Geography, 16(1), 42-54.
[3] Lucas, K. (2012). Transport and social exclusion: Where are we now? Transport Policy, 20, 105-113.
Martens, K. (2013). Role of the Bicycle in the Limitation of Transport Poverty in the Netherlands in Bicycles: Planning, Design, Operations, and Infrastructure. Transportation Research Record, 2387, 20-25.
Toronto Public Health. (2012a). Road to Health: Improving Walking and Cycling. http://www1.toronto.ca/wps/portal/contentonly?vgnextoid=2685970aa08c1410VgnVCM10000071d60f89RCRD.
The post The twisted myth of car ownership in Scarborough appeared first on Spacing National.

